Practical No 8
Develop a data dlow diagram using dfd ,division table & ER diagram
Data Flow Diagrams are used to represent the flow of data as well as the processes and functions involved to store, manipulate, and distribute data among various components of the system and between the system and the environment of the system by a specific set of graphical representations. It also depicts the logical flow of information in a system and appropriately defines and determines the physical requirements for the construction of the system. The key features of a Data Flow Diagram involve simplicity of notation as well as generation of a clear overview of the manual and automated requirements of the system.
Level 0 DFD :
This level is also known as Context Level DFD. At this level, only the interacting inputs and outputs with a system are described. The DFD of this level is shown in the diagram
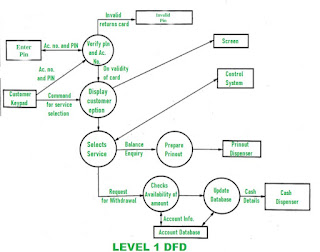
Level 1 DFD :
At this level, more detailed information is given about the processing of the ATM system. The DFD of this level is shown in the diagram:
Level 0 DFD
Deciscion Table -
Bank Management System R Diagram – serves as the basis of Bank Management System as the database design which could make the ERD project building in a simple way.
This BMS database design was made based on managing the bank requirements. The system can secure and monitor the activities or transactions of the customer. The bank admin can have access to the clients’ status during checking of transactions. All in all, they can handle and secure the client’s every activities.
The features included in this BMS Management system’s ERD were the security and monitoring of the customer’s transaction records and status. These features were also listed and recorded in reports that served as the history of all the activities done in the system.
Result : We have developed data flow diagram ,Deission table, Er diagram of bank management system.


